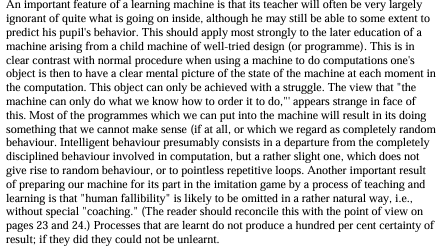
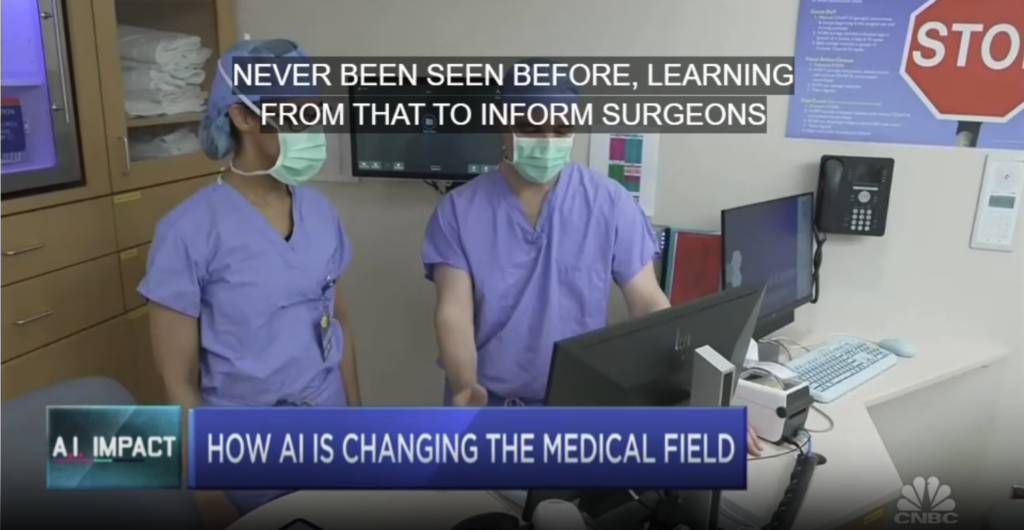
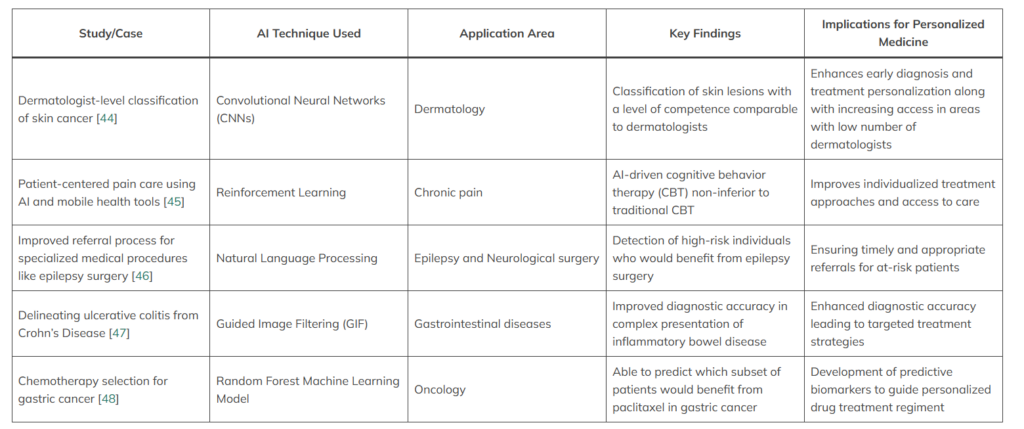
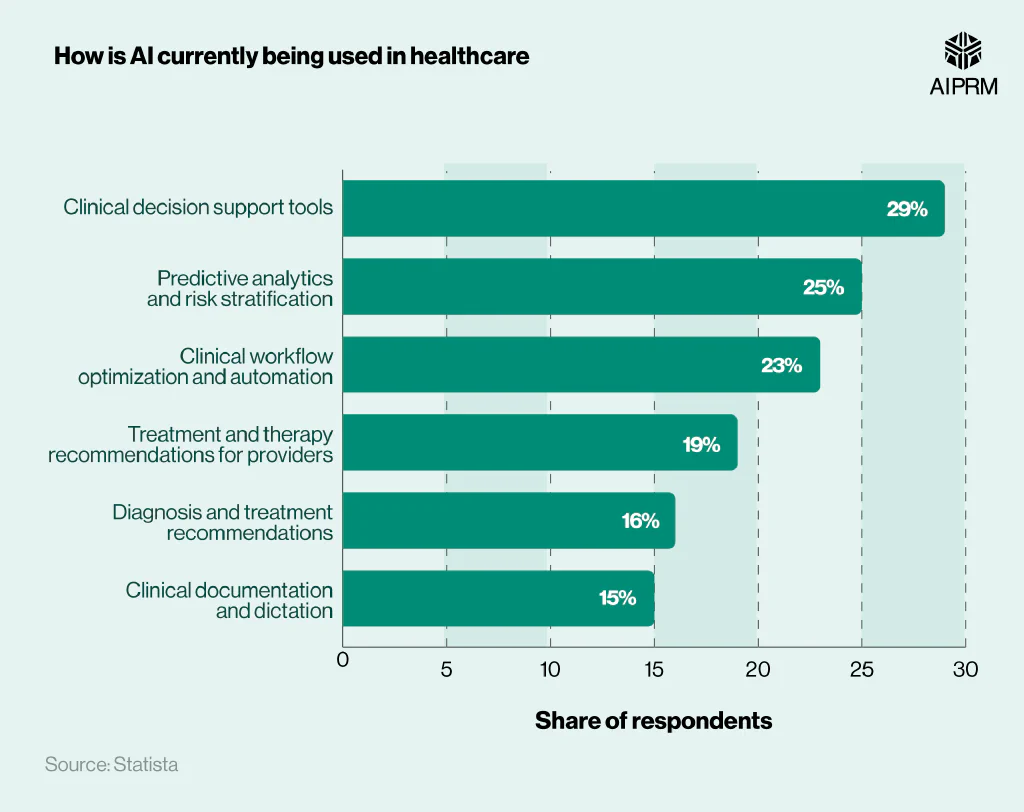
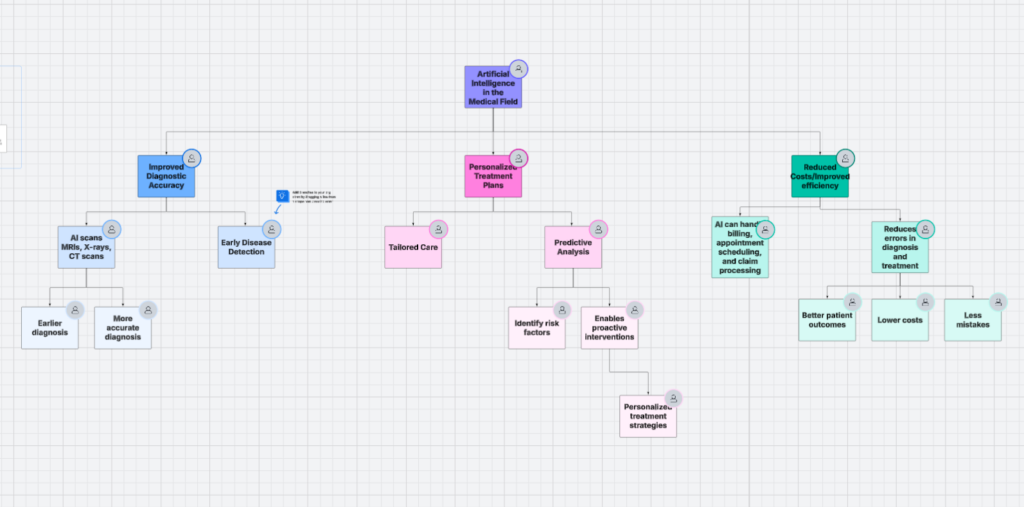
Gallery Entry 1: First Artifact. This is a sample from Alan Turing’s Paper in 1950 that he wrote when discussing the use of artificial intelligence.Gallery Entry 2: Second Artifact. This video shows the power AI has in assisting surgeons and other medical professionals in ways that haven’t been done before. Gallery Entry 3: Third Artifact. This article discusses how AI was invented in the 1950’s and how it has improved. This table shows what methods AI would use to diagnose a patient and how it can detect symptoms early.Gallery Entry 6: This is a bar graph showing all of the different ways that AI is assisting in the healthcare industry, and all of them are positive.